vue实现 【echarts中 “9种” Pie饼图图例】的组件封装及调用_echarts pie-程序员宅基地
技术标签: echarts elementui vue.js
echarts组件使用参考:https://blog.csdn.net/weixin_50450473/article/details/121510438
目录
图例一:
图例二:
图例三:
图例四:

图例五:

图例六:
图例七:自定义显示内容
图例八:
图例九:
图例十:

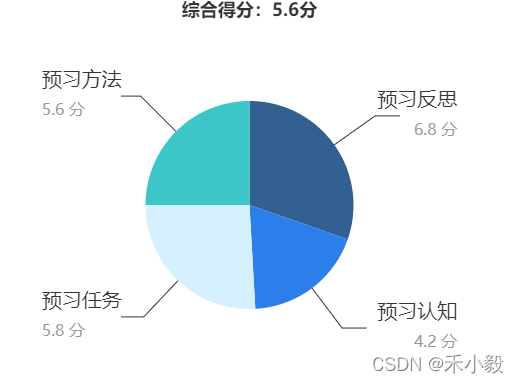
图例一
let datas = [
  { value: 6.8, name: '预习反思' },
  { value: 4.2, name: '预习认知' },
  { value: 5.8, name: '预习任务' },
  { value: 5.6, name: '预习方法' }
];
let sum = 0;
datas.forEach((s) => {
  sum += s.value;
});
let avgNum = (sum / datas.length).toFixed(1);

option = {
  color: ['#326092', '#2c7eeb', '#d5f1ff', '#3dc6c8', '#becae0', '#4d8fc6'],
  title: {
    text: '综合得分:' + avgNum + '分',
    left: 'center'
  },
  grid: {
    top: '0',
    left: '0%',
    right: '0%',
    bottom: '0%',
    containLabel: true
  },
  legend: {
    orient: 'vertical',
    left: 'left',
    show: false
  },
  series: [
    {
      type: 'pie',
      radius: '50%',
      labelLine: {
        length: 50, // 改变标示线的长度
        lineStyle: {
          color: '#333' // 改变标示线的颜色
        }
      },
      label: {
        alignTo: 'edge',
        formatter: '{name|{b}}\n{time|{c} 分}',
        edgeDistance: 10,
        lineHeight: 30,
        fontSize: 20,
        rich: {
          time: {
            fontSize: 16,
            color: '#999'
          }
        },
        textStyle: {
          color: '#333'
        }
      },
      data: datas
    }
  ]
};
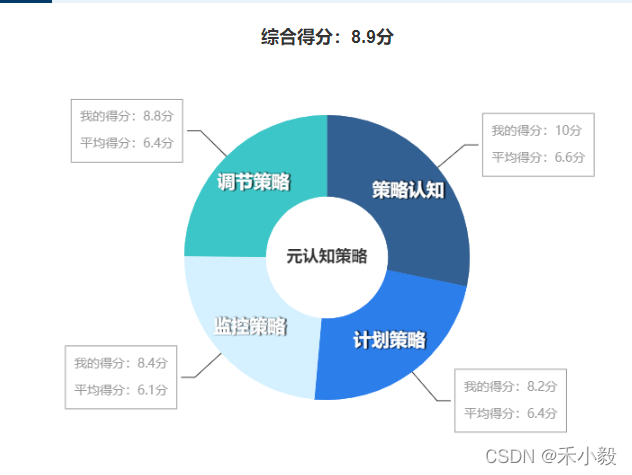
图例二
let datas = [
{ Score: 10, AveScore: 6.6, Name: '策略认知' },
{ Score: 8.2, AveScore: 6.4, Name: '计划策略' },
{ Score: 8.4, AveScore: 6.1, Name: '监控策略' },
{ Score: 8.8, AveScore: 6.4, Name: '调节策略' }
];
let nameList = [];
datas.forEach((fa) => {
nameList.push({ name: fa.Name, value: fa.Score, ave: fa.AveScore });
});
option = {
color: ['#326092', '#2c7eeb', '#d5f1ff', '#3dc6c8', '#becae0', '#4d8fc6'],
title: {
text: '元认知策略',
left: 'center',
top: 'center'
},
grid: {
top: '0',
left: '0%',
right: '0%',
bottom: '0%',
containLabel: true
},
legend: {
orient: 'vertical',
left: 'left',
show: false
},
series: [
{
type: 'pie',
radius: ['30%', '70%'],
label: {
alignTo: 'edge',
position: 'inner',
formatter: '{b}',
fontSize: 20,
textStyle: {
fontWeight: 'bold',
textShadowColor: '(0,0,0,.1)', // 文字阴影
textShadowBlur: 1,
textShadowOffsetX: 1
}
},
data: nameList
},
{
type: 'pie',
radius: ['30%', '70%'],
labelLine: {
length: 40, // 改变标示线的长度
lineStyle: {
color: '#333' // 改变标示线的颜色
}
},
label: {
formatter: function (params) {
return (
'我的得分:' +
params.data.value +
'分\n平均得分:' +
params.data.ave +
'分'
);
},
lineHeight: 30,
fontSize: 14,
textStyle: {
color: '#999',
borderColor: '#999',
padding: [5, 10],
borderWidth: 1
}
},
data: nameList
}
]
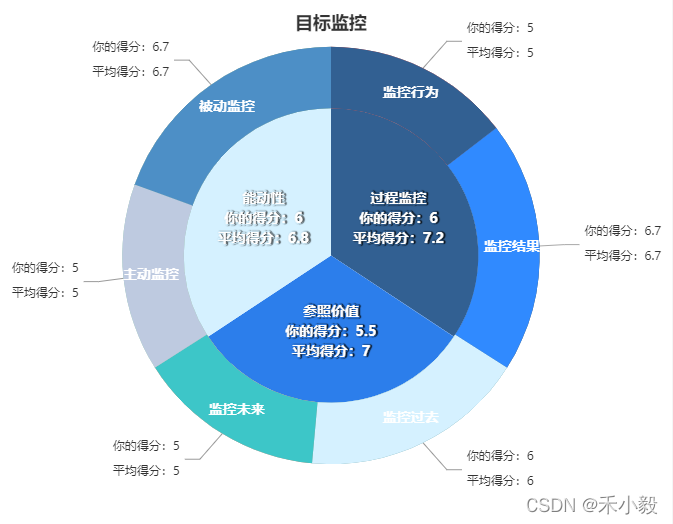
};图例三
let datas = [
  {
    Name: '过程监控',
    DivideScore: 7.2,
    UserScore: 6,
    Children: [
      { Name: '监控行为', DivideScore: 5, UserScore: 5 },
      { Name: '监控结果', DivideScore: 6.7, UserScore: 6.7 }
    ]
  },
  {
    Name: '参照价值',
    DivideScore: 7,
    UserScore: 5.5,
    Children: [
      { Name: '监控过去', DivideScore: 5, UserScore: 5 },
      { Name: '监控未来', DivideScore: 6.7, UserScore: 6.7 }
    ]
  },
  {
    Name: '能动性',
    DivideScore: 6.8,
    UserScore: 6,
    Children: [
      { Name: '主动监控', DivideScore: 5, UserScore: 5 },
      { Name: '被动监控', DivideScore: 6.7, UserScore: 6.7 }
    ]
  }
];
let colorList = ['#326092', '#2c7eeb', '#d5f1ff', '#3dc6c8', '#becae0', '#4d8fc6'];
let fatherName = [];
let childName = [];
datas.forEach((ma, index) => {
  fatherName.push({
    name: ma.Name,
    value: ma.UserScore,
    avg: ma.DivideScore
  });
  ma.Children.forEach((chi) => {
    childName.push({
      name: chi.Name,
      value: chi.UserScore,
      avg: chi.DivideScore
    });
  });
});

option = {
  title: {
    text: '目标监控',
    left: 'center'
  },
  series: [
    {
      type: 'pie',
      radius: [0, '60%'],
      itemStyle: {
        normal: {
          label: {
            position: 'inner',
            formatter: function (params) {
              return (
                params.data.name +
                '\n你的得分:' +
                params.data.value +
                '\n平均得分:' +
                params.data.avg
              );
            },
            fontSize: 14,
            lineHeight: 20,
            textStyle: {
              fontWeight: 'bold',
              textShadowColor: '(0,0,0,.1)', // 文字阴影
              textShadowBlur: 1,
              textShadowOffsetX: 1
            }
          },
          // 每个柱子的颜色即为colorList数组里的每一项,如果柱子数目多于colorList的长度,则柱子颜色循环使用该数组
          color: function (params) {
            return colorList[params.dataIndex];
          }
        }
      },
      labelLine: {
        show: false
      },
      data: fatherName
    },
    {
      type: 'pie',
      radius: ['60%', '85%'],
      itemStyle: {
        normal: {
          label: {
            position: 'inner',
            formatter: '{b|{b}}',
            color: '#999',
            rich: {
              b: {
                color: '#fff',
                fontSize: 14,
                fontWeight: 'bold'
              }
            }
          }
        }
      },
      data: childName
    },
    {
      type: 'pie',
      radius: ['60%', '85%'],
      labelLine: {
        length: 30, // 改变标示线的长度
        lineStyle: {
          color: '#999' // 改变标示线的颜色
        }
      },
      itemStyle: {
        normal: {
          label: {
            formatter: function (params) {
              return (
                '你的得分:' +
                params.data.value +
                '\n平均得分:' +
                params.data.value
              );
            },
            color: '#333',
            fontSize: 12,
            lineHeight: 25,
            rich: {
              b: {
                fontSize: 16,
                fontWeight: 'bold'
              },
              c: {
                fontSize: 16
              }
            }
          },
          // 每个柱子的颜色即为colorList数组里的每一项,如果柱子数目多于colorList的长度,则柱子颜色循环使用该数组
          color: function (params) {
            return colorList[params.dataIndex];
          }
        }
      },
      data: childName
    }
  ]
};
图例四
let branch = 32, branchTotal = 146; //科数
let species = 82, speciesTotal = 608; //种数
option = {
  title: [
    {
      text: '占全国湿地维管束植物',
      textStyle: {
        fontSize: 14,
        color: '#333'
      },
      subtext: '总科数',
      subtextStyle: {
        color: '#333',
        fontSize: 14,
        fontWeight: 'bold'
      },
      left: '20%',
      top: '65%',
      textAlign: 'center'
    },
    {
      text: '占全国湿地维管束植物',
      textStyle: {
        fontSize: 14,
        color: '#333'
      },
      subtext: '总种数',
      subtextStyle: {
        color: '#333',
        fontSize: 14,
        align: 'center',
        fontWeight: 'bold'
      },
      left: '70%',
      top: '65%',
      textAlign: 'center'
    }
  ],
  series: [
    {
      name: '总科数',
      type: 'pie',
      hoverAnimation: false,
      radius: ['20%', '25%'],
      center: ['20%', '50%'],
      label: {
        show: false
      },
      data: [
        {
          value: branch,
          name: '总科数',
          label: {
            show: true,
            position: 'center',
            formatter: '{b|{b}}\n{d|{d}}%',
            rich: {
              b: {
                fontSize: 14,
                lineHeight: 30,
                color: '#333'
              },
              d: {
                fontSize: 24,
                color: '#333',
                fontWeight: 'bold'
              }
            },
            color: '#333'
          },
          itemStyle: {
            normal: {
              color: '#1890FF'
            }
          }
        },
        {
          value: branchTotal - branch,
          //不需要显示的数据,颜色设置成和背景一样
          itemStyle: {
            normal: {
              color: '#F0F2F5'
            }
          }
        }
      ]
    },
    {
      name: '总种数',
      type: 'pie',
      hoverAnimation: false,
      radius: ['20%', '25%'],
      center: ['70%', '50%'],
      label: {
        show: false
      },
      data: [
        {
          value: species, //需要显示的数据
          name: '总种数',
          label: {
            show: true,
            position: 'center',
            formatter: '{b|{b}}\n{d|{d}}%',
            rich: {
              b: {
                fontSize: 14,
                lineHeight: 30,
                color: '#333'
              },
              d: {
                fontSize: 24,
                color: '#333',
                fontWeight: 'bold'
              }
            },
            color: '#333'
          },
          itemStyle: {
            normal: {
              color: '#FAFA14'
            }
          }
        },
        {
          value: speciesTotal - species,
          //不需要显示的数据,颜色设置成和背景一样
          itemStyle: {
            normal: {
              color: '#F0F2F5'
            }
          }
        }
      ]
    }
  ]
};
图例五
option = {
tooltip: {
trigger: 'item',
formatter: '{a} <br/>{b}: {c} ({d}%)'
},
legend: {
orient: 'vertical',
right: '5%',
top: '20%',
icon: 'circle',
textStyle: {
color: '#333',
fontSize: 20
},
data: ['防火四级', '防火三级', '防火二级', '防火一级']
},
series: [
{
name: '火险等级',
type: 'pie',
radius: ['50%', '70%'],
avoidLabelOverlap: false,
label: {
show: true,
position: 'center',
color: '#333'
},
emphasis: {
label: {
show: true,
fontSize: 20,
fontWeight: 'bold'
}
},
labelLine: {
show: false
},
data: [
{
value: 50,
name: '防火一级',
itemStyle: {
normal: {
color: 'rgba(53,130,247,0.6)',
borderColor: 'rgba(53,130,247,0.8)',
borderWidth: 3,
shadowColor: 'rgba(53,130,247,0.8)',
shadowBlur: 10
}
}
},
{
value: 30,
name: '防火二级',
itemStyle: {
normal: {
color: 'rgba(244,201,7,0.5)',
borderColor: 'rgba(244,201,7,0.8)',
borderWidth: 3,
shadowColor: 'rgba(244,201,7,0.8)',
shadowBlur: 10
}
}
},
{
value: 20,
name: '防火三级',
itemStyle: {
normal: {
color: 'rgba(25,236,176,0.5)',
borderColor: 'rgba(25,236,176,0.8)',
borderWidth: 3,
shadowColor: 'rgba(25,236,176,0.8)',
shadowBlur: 10
}
}
},
{
value: 10,
name: '防火四级',
itemStyle: {
normal: {
color: 'rgba(134,66,255,0.6)',
borderColor: 'rgba(134,66,255,0.8)',
borderWidth: 3,
shadowColor: 'rgba(134,66,255,0.8)',
shadowBlur: 10
}
}
}
],
center: ['35%', '50%']
}
]
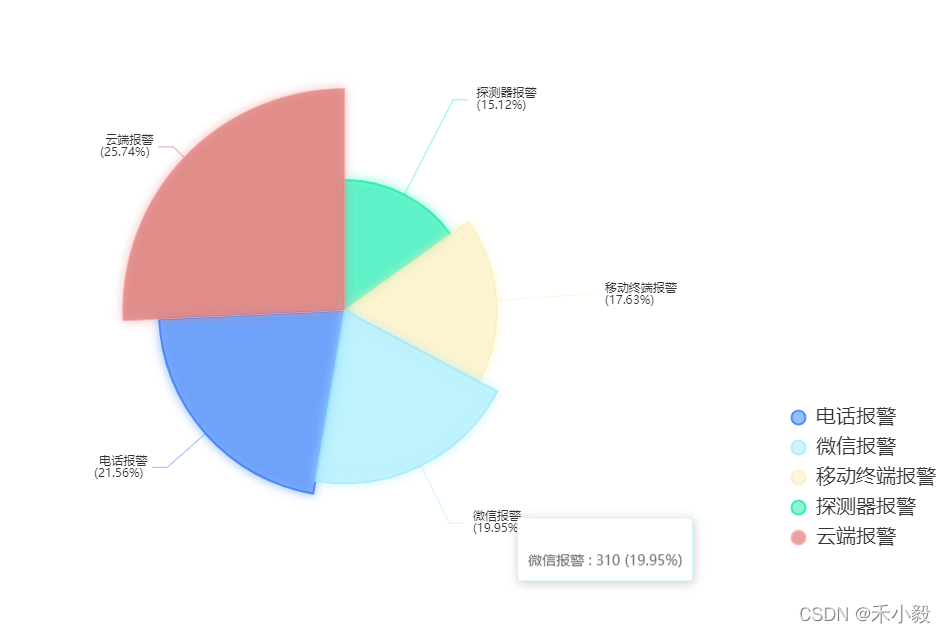
};图例六
option = {
tooltip: {
trigger: 'item',
formatter: '{a} <br/>{b} : {c} ({d}%)'
},
legend: {
bottom: '20%',
icon: 'circle',
orient: 'vertical',
left: '75%',
textStyle: {
color: '#333',
fontSize: 20
},
data: ['电话报警', '微信报警', '移动终端报警', '探测器报警', '云端报警']
},
visualMap: {
show: false,
min: 80,
max: 600,
inRange: {
colorLightness: [0, 1]
}
},
series: [
{
name: '',
type: 'pie',
radius: '55%',
center: ['35%', '50%'],
data: [
{
value: 335,
name: '电话报警',
itemStyle: {
normal: {
color: 'rgba(50,123,250,0.5)',
borderColor: 'rgba(50,123,250,0.8)',
borderWidth: 2,
shadowColor: 'rgba(50,123,250,0.8)',
shadowBlur: 10
}
}
},
{
value: 310,
name: '微信报警',
itemStyle: {
normal: {
color: 'rgba(160,234,253,0.5)',
borderColor: 'rgba(160,234,253,0.8)',
borderWidth: 2,
shadowColor: 'rgba(160,234,253,0.8)',
shadowBlur: 10
}
}
},
{
value: 274,
name: '移动终端报警',
itemStyle: {
normal: {
color: 'rgba(252,238,187,0.5)',
borderColor: 'rgba(252,238,187,0.8)',
borderWidth: 2,
shadowColor: 'rgba(252,238,187,0.8)',
shadowBlur: 10
}
}
},
{
value: 235,
name: '探测器报警',
itemStyle: {
normal: {
color: 'rgba(25,236,176,0.5)',
borderColor: 'rgba(25,236,176,0.8)',
borderWidth: 2,
shadowColor: 'rgba(25,236,176,0.8)',
shadowBlur: 10
}
}
},
{
value: 400,
name: '云端报警',
itemStyle: {
normal: {
color: 'rgba(215,102,98,0.6)',
borderColor: 'rgba(255,169,166,0.8)',
borderWidth: 1,
shadowColor: 'rgba(215,102,98,0.6)',
shadowBlur: 10
}
}
}
].sort(function (a, b) {
return a.value - b.value;
}),
roseType: 'radius',
label: {
formatter: '{a} {b}\n ({d}%) '
},
itemStyle: {
shadowBlur: 200,
shadowColor: 'rgba(0, 0, 0, 0.5)'
},
animationType: 'scale',
animationEasing: 'elasticOut',
animationDelay: function (idx) {
return Math.random() * 200;
}
}
]
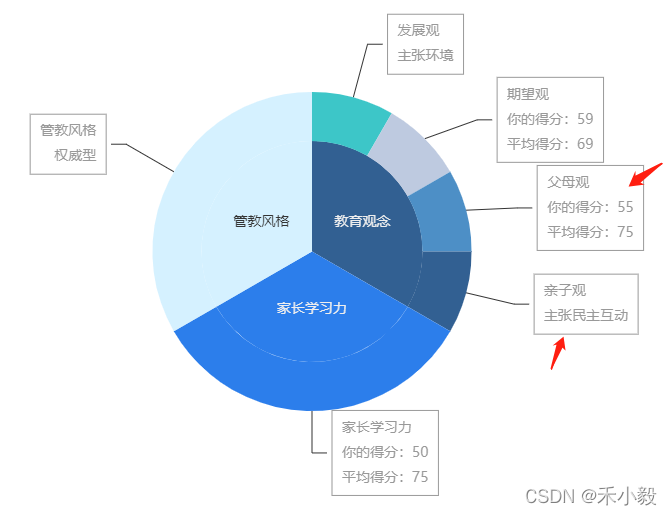
};图例七
let datas = [
{
Name: '教育观念',
Title: '',
Score: null,
SumAvgScore: null,
Children: [
{ Score: 0.0, SumAvgScore: 0.0, Name: '发展观', Title: '主张环境' },
{ Score: 69.0, SumAvgScore: 69.0, Name: '期望观' },
{ Score: 70.0, SumAvgScore: 75.0, Name: '父母观' },
{ Score: 0.0, SumAvgScore: 0.0, Name: '亲子观', Title: '主张奖励' }
]
},
{
Name: '家长学习力',
Title: '',
Score: null,
SumAvgScore: null,
Children: [{ Score: 31.0, SumAvgScore: 75.0 }]
},
{
Name: '管教风格',
Title: '',
Score: null,
SumAvgScore: null,
Children: [
{ Score: 0.0, SumAvgScore: 0.0, Title: '专制型', Name: '您的管教风格:' }
]
}
];
let fatherName = [];
let childName = [];
datas.forEach((ma, index) => {
if (ma.Name === '教育观念') {
ma.Children.map((m) => {
childName.push({
name: m.Name,
value: 1,
SumAvgScore: m.SumAvgScore,
Score: m.Score,
Title: m.Title
});
});
} else {
ma.Children.map((m) => {
childName.push({
name: ma.Name,
value: 4,
SumAvgScore: m.SumAvgScore,
Score: m.Score,
Title: m.Title
});
});
}
fatherName.push({
name: ma.Name,
value: 1,
SumAvgScore: ma.SumAvgScore
});
});
option = {
color: ['#326092', '#2c7eeb', '#d5f1ff', '#3dc6c8', '#becae0', '#4d8fc6'],
series: [
{
type: 'pie',
selectedMode: 'single',
radius: [0, '45%'],
label: {
position: 'inner',
fontSize: 14
},
labelLine: {
show: false
},
data: fatherName
},
{
type: 'pie',
radius: ['45%', '65%'],
labelLine: {
length: 55, // 改变标示线的长度
lineStyle: {
color: '#333' // 改变标示线的颜色
}
},
label: {
formatter: function (params) {
if (params.data.Title) {
return params.data.name + '\n' + params.data.Title;
} else {
return (
params.data.name +
'\n你的得分:' +
params.data.Score +
'\n平均得分:' +
params.data.SumAvgScore
);
}
},
lineHeight: 25,
fontSize: 14,
textStyle: {
color: '#999',
borderColor: '#999',
padding: [5, 10],
borderWidth: 1
},
rich: {
b: {
color: '#4C5058',
fontSize: 14,
fontWeight: 'bold',
lineHeight: 33
}
}
},
data: childName
}
]
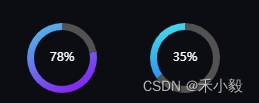
};图例八
let branchTotal = 100;
let press = 30;
let colorType = 0;
option = {
backgroundColor: '#000',
series: [
{
type: 'pie',
clockwise: false, // 逆时针
hoverAnimation: false,
radius: ['80%', '100%'],
label: {
show: false
},
itemStyle: {
color: function (params) {
let colorList1 = ['#47C9E5', '#47E4E5'];
let colorList2 = ['#832BF3', '#2B8EF3'];
return new echarts.graphic.LinearGradient(0, 0, 0.5, 1, [
{ offset: 0, color: colorList1[colorType] },
{ offset: 1, color: colorList2[colorType] }
]);
},
borderRadius: 0, // 设置所有圆角
// barBorderRadius: [50, 50, 0, 0]
},
data: [
{
value: press,
label: {
show: true,
position: 'center',
formatter: '{d|{d}}%',
rich: {
d: {
fontSize: 12,
color: '#fff'
}
},
color: '#fff'
},
itemStyle: {
borderRadius: 0, // 设置当前单个占比圆角
shadowColor: '#2a2a34'
}
},
{
value: branchTotal - press,
//不需要显示的数据,颜色设置成和背景一样
itemStyle: {
normal: {
color: '#525252'
}
}
}
]
}
]
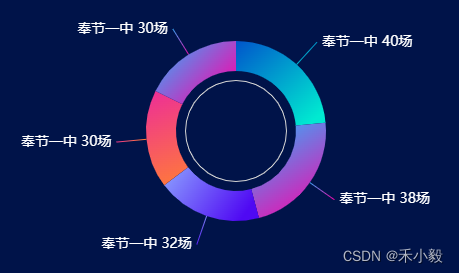
};图例九
option = {
  backgroundColor: '#333',
  series: [
    {
      type: 'pie',
      radius: [60, 90],
      center: ['50%', '50%'],
      itemStyle: {
        color: function (params) {
          let colorList1 = ['#0055CB', '#27B7FF', '#8CA2FF', '#ED2D98', '#27B7FF', '#ED2D98','#0055CB','#8CA2FF',];
          let colorList2 = ['#00EAD1', '#F408AB', '#4F09F3', '#FF793B', '#F408AB', '#FF793B','#00EAD1','#4F09F3',];
          return new echarts.graphic.LinearGradient(0, 0, 0.8, 1, [
            { offset: 0, color: colorList1[params.dataIndex] },
            { offset: 1, color: colorList2[params.dataIndex] }
          ]);
        },
        barBorderRadius: [50, 50, 0, 0] // 统一设置四个角的圆角大小
      },
      label: {
        normal: {
          show: true,
          color: '#fff',
          fontSize: 14,
          formatter: function (params) {
            return params.data.Name + ' ' + params.data.value + '场';
          }
        }
      },
      labelLine: {
        length: 30,
        color: '#fff',
        length2: 0
      },
      data: [
        { value: 40, name: '1', Name: '奉节一中' },
        { value: 38, name: '2', Name: '奉节一中' },
        { value: 32, name: '3', Name: '奉节一中' },
        { value: 30, name: '4', Name: '奉节一中' },
        { value: 30, name: '5', Name: '奉节一中' }
      ]
    },
    {
      type: 'pie',
      radius: [50, 51]
    }
  ]
};
图例十
let colorList1 = ['#2B8EF3', '#58CF99', '#FF9F52'];
let colorList2 = ['#ABD1FF', '#AFE8CE', '#FFDFC6'];
let colorList3 = ['#D2E6FF', '#E7FFF4', '#FFEEE0'];
let colorList4 = ['#4A9AFC', '#1DDF87', '#FFBF8B'];
let colorType = 0;
let currValue = 30;
let branchTotal = 100;
let unit = '%';
option = {
  series: [
    {
      z: 1,
      type: 'pie',
      clockwise: true, // 逆时针
      hoverAnimation: false,
      radius: ['82%', '95%'],
      label: {
        show: false
      },
      itemStyle: {
        color: colorList1[colorType],
        borderRadius: 80
      },
      data: [
        {
          value: currValue,
          label: {
            show: true,
            borderRadius: 20,
            padding: 9,
            position: 'center',
            formatter: `\n{d|{d}} {unit|${unit}}`,
            rich: {
              d: {
                fontSize: 26,
                fontWeight: 600,
                color: '#000'
              },
              unit: {
                fontSize: 20,
                fontWeight: 600,
                color: '#3C3B3B'
              }
            },
            color: '#000'
          },
          itemStyle: {
            borderRadius: 60,
            shadowColor: '#2a2a34'
          }
        },
        {
          value: branchTotal - currValue,
          //不需要显示的数据,颜色设置成和背景一样
          itemStyle: {
            normal: {
              color: colorList2[colorType]
            }
          }
        }
      ]
    },
    // 尾端小圆点 饼图
    {
      z: 2,
      type: 'pie',
      // 饼图大小跟外层极坐标系相同,需手动调试
      radius: ['76%', '90%'],
      hoverAnimation: false,
      startAngle: 180,
      endAngle: 0,
      silent: 1,
      data: [
        // 实际值,背景色透明
        {
          name: '',
          value:
            currValue > 75
              ? (25 - (100 - currValue)) / 100
              : (25 + currValue) / 100,
          label: {
            show: false
          },
          labelLine: {
            show: false
          },
          itemStyle: {
            color: 'transparent'
          }
        },
        {
          // 画中间的图标
          value: 0,
          label: {
            position: 'inside',
            backgroundColor: colorList4[colorType],
            borderRadius: 20,
            padding: 9
          }
        },
        // 透明填充 angleAxis 的max相同 max : 2
        {
          value:
            currValue > 75
              ? 1 - (25 - (100 - currValue)) / 100
              : 1 - (25 + currValue) / 100,
          label: {
            show: false
          },
          labelLine: {
            show: false
          },
          itemStyle: {
            color: 'transparent'
          }
        }
      ]
    },
    {
      z: 0,
      type: 'pie',
      radius: ['0', '82%'],
      data: [1],
      itemStyle: {
        normal: {
          color: colorList3[colorType]
        }
      },
      label: {
        show: false
      }
    }
  ]
};
希望我的愚见能够帮助你哦~,若有不足之处,还望指出,你们有更好的解决方法,欢迎大家在评论区下方留言支持,大家一起相互学习参考呀~
智能推荐
CCKS2020 任务三 面向中文电子病历的医疗实体及事件抽取_ccks2020数据集医学-程序员宅基地
文章浏览阅读1.9k次。CCKS2020 任务三 本任务是CCKS围绕中文电子病历语义化开展的系列评测的一个延续,在CCKS 2017,2018, 2019相关评测任务的基础上进行了延伸和拓展。 本任务包括两个子任务: (1) 医疗命名实体识别:于给定的一组电子病历纯文本文档,识别并抽取出与医学临床相关的..._ccks2020数据集医学
Failed to resolve: com.android.support.constraint:constraint-layout:1.0.2-程序员宅基地
文章浏览阅读5.7k次。Failed to resolve: com.android.support.constraint:constraint-layout:1.0.2 Install repository and sync project. Show in file. Show in project structure dialog. 未能解决:com.android.support.const_com.android.support.constraint:constraint-layout:1.0.2 jar
MongoDB副本集(一主一备+仲裁)环境部署_mongdb4.0.15 副本集 1个primary +1个 secondary +1个arbite-程序员宅基地
文章浏览阅读3k次。MongoDB复制集是一个带有故障转移的主从集群。是从现有的主从模式演变而来,增加了自动故障转移和节点成员自动恢复。MongoDB复制集模式中没有固定的主结点,在启动后,多个服务节点间将自动选举产生一个主结点。该主结点被称为primary,一个或多个从结点被称为secondaries。primary结点基本上就是master结点,不同之处在于primary结点在不同时间可能是不同的服务器。如果当前的主结点失效了,复制集中的其余结点将会试图选出一个新的主结点。MongoDB提供了两种复制部署方案:主从复制_mongdb4.0.15 副本集 1个primary +1个 secondary +1个arbiter(仲裁者)
问题:Element-ui中DateTimePicker设置了default-time和picker-options(时间选择范围)后无法选择当天日期_el-date-picker 不能选择当天时间-程序员宅基地
文章浏览阅读3.3k次。一、问题描述 在设置完default-time及picker-options两个属性后,当选择当天时间时,无法选中填入时间!!<el-date-picker v-model="dateTime" unlink-panels value-format="yyyy-MM-dd HH:mm:ss" type="daterange" range-separator="~" start-placeholder="开始日期" _el-date-picker 不能选择当天时间
guitar pro8值不值得买 ?guitarpro8多少钱-程序员宅基地
文章浏览阅读550次,点赞10次,收藏10次。Guitar Pro是一款备受吉他手喜爱的谱写软件,它提供了丰富的功能,使得谱写和学习吉他曲目变得更加轻松。随着时间的推移,软件也在进行不断地更新和升级,为用户带来了更多便利和功能。在最新的Guitar Pro 8版本中增加了新功能,下面来给大家介绍guitar pro8值不值得买?guitarpro8多少钱的具体内容。Guitar Pro 8是一款值得购买的音乐编奏软件。它有许多高效的功能,使得谱写、编辑和学习乐谱变得更加便利。下面是Guitar Pro 8的一些主要功能。_guitar pro8
成功替代SA605DK:不使用SA605的ISO15693中大功率中远距离RFID读写器设计实例,完美替代NXP/PHILIPS的SA605/NE605/SA615/SA636/SA605D-程序员宅基地
文章浏览阅读485次。不使用任何NXP/PHILIPS已停产的SA605/SA605D/SA605DK/NE605/SA615/SA636等混频器芯片的ISO15693中大功率中远距离RFID读写器,完美替代SA605DK,所有射频芯片均为全新且量产易购买的,单片机采用超低成本的国产STC单片机,通讯为:USB串口和TTL串口,发射功率为。更多资料:http://www.iso15693.com。
随便推点
【转载】struct dirent 和 DIR结构体 详解-程序员宅基地
文章浏览阅读356次。原文地址:https://blog.csdn.net/sin0803/article/details/375393131.包含头文件#include <dirent.h>2.struct dirent结构1 struct dirent2 {3 long d_ino; /* inode number 索引节点号 */4 off_t ..._struct dirnet
Simplicity Studio 4 用法_simplicity studio 4.0 uart-程序员宅基地
文章浏览阅读1.4w次,点赞2次,收藏8次。刚刚用了EFM32的Simplicity Studio 4 软件 来记录一下用法,软件可以去官网下载。第一步:首先连接好板子,打开这个软件,更新一下包,如图:后面的跟着步骤来就行,然后就等下载完成,根据网速吧,网速不好就需要等好久,趁这个时间可以泡一杯咖啡喝......第二步:配置芯片型号:点击左上角的箭头,右键选择 Device Configuration ,然后跳出一个窗口选择你所用到的芯片,..._simplicity studio 4.0 uart
yolov5 Tensorrt加速 zed取图像碰到的问题_yolov5_zed: /home/xu/tensorrt_yolov5_v6.0/src/yolo-程序员宅基地
文章浏览阅读1.4k次。原程序的功能是将samples文件夹里的照片一次性进行识别。想改变程序,用zed拍照,达到实时显示识别的目的,但是加了while(1)以及zed grab后,报错:[08/04/2020-16:01:13] [E] [TRT] …/rtSafe/safeContext.cpp (133) - Cudnn Error in configure: 7 (CUDNN_STATUS_MAPPING_ERROR)[08/04/2020-16:01:13] [E] [TRT] FAILED_EXECUTION: s_yolov5_zed: /home/xu/tensorrt_yolov5_v6.0/src/yolov5.cpp:73: nvinfer1::icuda
Linux命令可以在后台运行,不随shell的关闭而关闭_不结束shell界面命令挅作是-程序员宅基地
文章浏览阅读5.6k次。我们在服务器上运行的了一个服务,肯定不想CTRL+C退出日志打印平台后,服务就停止了,即使是我们关闭了远程访问服务器的Shell窗口,也不要关闭。下面就是解决这个问题的干货了:1、&在运行命令的后面添加&,表示让让程序在后台运行,所以你CTRL+C后退出了日志打印,服务仍然会运行到后台。2、nohup可是你发现没有,即使添加了&,我们关闭访问服务器的窗口后,服务还..._不结束shell界面命令挅作是
【30篇突击 android】源码统计 十八-程序员宅基地
文章浏览阅读411次。android手机控制电脑源码 android手机可视化控制电脑-无线鼠盘源码 自定义TextView跑马灯效果,可控制启动,停止,和速度 Android自定义Menu,所有功能已经完善 下拉菜单3级联动,天气预报模拟豆瓣。并获取一些个人信息。Android 仿QQ客户端及服务端源码android 斗地主源码分享ImageCache,图片缓存工具类,可直接用于项目(
ubuntu卸载显卡驱动和cuda_在乌班图安全模式下能删除显卡吗-程序员宅基地
文章浏览阅读1.7k次。2.卸载驱动sudo apt-get --purge remove nvidia*sudo apt autoremoveTo remove CUDA Toolkit:$ sudo apt-get --purge remove “cublas” “cuda*”To remove NVIDIA Drivers:$ sudo apt-get --purge remove “nvidia”..._在乌班图安全模式下能删除显卡吗