Python-Matplolib_python matp-程序员宅基地
技术标签: python
文章目录
概述
# Version
# pip install matplotlib==3.42

import numpy as np
import pandas as pd
import matplotlib.pyplot as plt

if __name__ == '__main__':
    ```Main function```
基础
绘图原理
matplotlib绘图的原理:在画布(figure)上绘制坐标系(axes),其中axes上的各个元素如下:

注意区分: Axes:整个坐标系;Axis:坐标系上的坐标轴;Artist:在figure上看到的所有元素都是Artist,包括:Figure,Axes,Axis,Text,Line2D,collections,Path对象等。
作图的方式
基于面向对象
x = np.linspace(0, 2, 100)
# Note that even in the OO-style, we use `.pyplot.figure` to create the figure.
fig, ax = plt.subplots()  # Create a figure and an axes.
ax.plot(x, x, label='linear')  # Plot some data on the axes.
ax.plot(x, x**2, label='quadratic')  # Plot more data on the axes...
ax.plot(x, x**3, label='cubic')  # ... and some more.
ax.set_xlabel('x label')  # Add an x-label to the axes.
ax.set_ylabel('y label')  # Add a y-label to the axes.
ax.set_title("Simple Plot")  # Add a title to the axes.
ax.legend()  # Add a legend.

基于pyplot接口
x = np.linspace(0, 2, 100)
plt.plot(x, x, label='linear')  # Plot some data on the (implicit) axes.
plt.plot(x, x**2, label='quadratic')  # etc.
plt.plot(x, x**3, label='cubic')
plt.xlabel('x label')
plt.ylabel('y label')
plt.title("Simple Plot")
plt.legend()

基于GUI
Figure和Axes整体布局
方式一
plt.figure(figsize=(5, 5)) # 先画一个figure
ax1 = plt.subplot(221) # subplot()只返回一个ax
ax1.set_title('221')
ax2 = plt.subplot(222)
ax2.set_title('222')

ax3 = plt.subplot(212)
ax3.set_title('212')
方式二
fig = plt.figure(constrained_layout= True) # 先画一个figure
ax0 = fig.add_subplot(221) # add_subplot()返回一个ax
ax0.set_title('ax0')
ax1 = fig.add_subplot(222)
ax1.set_title('ax1')
ax2 = fig.add_subplot(313)
ax2.set_title('ax1')
方式三
fig, (ax0, ax1) = plt.subplots(ncols= 2, nrows= 2, constrained_layout=True) # 先画一个figure,同时设计好所有ax,subplots()一次返回全部ax
ax0.set_title('ax0')
ax1.set_title('ax1')
ax2.set_title('ax2')
ax3.set_title('ax3')
Axes中的图形
柱状图
垂直柱状图
matplotlib.pyplot.bar(x, height, width=0.8, bottom=None, *, align='center', data=None, **kwargs)
# =============================================================================
# x, 柱子位置
# height, 柱子高度
# width, 柱子宽度,bar()时,默认0.8
# bottom, 柱子y值的起点,默认为0
# align, 柱子与x轴对齐方式
# color, 柱子颜色
# edgecolor, 柱子边缘颜色
# linewidth, 柱子边缘线宽
# tick_label, 柱子标签
# xerr, 误差
# yerr, 误差
# ecolor, 误差线颜色
# capsize, 误差SD大小
# log, 默认False,y轴取log值
# =============================================================================
import matplotlib.pyplot as plt
import numpy as np

N = 5
menMeans = (20, 35, 30, 35, -27)
womenMeans = (25, 32, 34, 20, -25)
menStd = (2, 3, 4, 1, 2)
womenStd = (3, 5, 2, 3, 3)
ind = np.arange(N)    # the x locations for the groups
width = 0.35       # the width of the bars: can also be len(x) sequence

fig, ax = plt.subplots()

p1 = ax.bar(ind, menMeans, width, yerr=menStd, label='Men')
p2 = ax.bar(ind, womenMeans, width,
            bottom=menMeans, yerr=womenStd, label='Women')

ax.axhline(0, color='grey', linewidth=0.8)
ax.set_ylabel('Scores')
ax.set_title('Scores by group and gender')
ax.set_xticks(ind)
ax.set_xticklabels(('G1', 'G2', 'G3', 'G4', 'G5'))
ax.legend()

# Label with label_type 'center' instead of the default 'edge'
ax.bar_label(p1, label_type='center') # 在柱子上添加标签
ax.bar_label(p2, label_type='center')
ax.bar_label(p2)

plt.show()

水平柱状图
matplotlib.pyplot.barh(x, height, width=0.8, bottom=None, *, align='center', data=None, **kwargs)
# =============================================================================
# x, 柱子位置
# height, 柱子高度,barh()时,默认0.8
# width, 柱子宽度
# bottom, 柱子y值的起点,默认为0
# align, 柱子与x轴对齐方式
# color, 柱子颜色
# edgecolor, 柱子边缘颜色
# linewidth, 柱子边缘线宽
# tick_label, 柱子标签
# xerr, 误差
# yerr, 误差
# ecolor, 误差线颜色
# capsize, 误差SD大小
# log, 默认False,y轴取log值
# =============================================================================
import matplotlib.pyplot as plt
import numpy as np

# Fixing random state for reproducibility
np.random.seed(19680801)


plt.rcdefaults()
fig, ax = plt.subplots()

# Example data
people = ('Tom', 'Dick', 'Harry', 'Slim', 'Jim')
y_pos = np.arange(len(people))
performance = 3 + 10 * np.random.rand(len(people))
error = np.random.rand(len(people))

ax.barh(y_pos, performance, xerr=error, align='center')
ax.set_yticks(y_pos)
ax.set_yticklabels(people)
ax.invert_yaxis()  # labels read top-to-bottom,反向排序
ax.set_xlabel('Performance')
ax.set_title('How fast do you want to go today?')

plt.show()

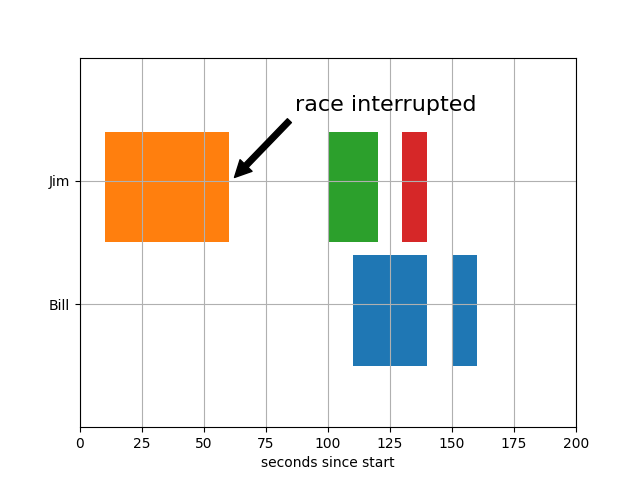
跳跃柱状图
matplotlib.pyplot.broken_barh(xranges, yrange, *, data=None, **kwargs)
import matplotlib.pyplot as plt

fig, ax = plt.subplots()
ax.broken_barh([(110, 30), (150, 10)], (10, 9), facecolors='tab:blue')
ax.broken_barh([(10, 50), (100, 20), (130, 10)], (20, 9),
               facecolors=('tab:orange', 'tab:green', 'tab:red'))
ax.set_ylim(5, 35)
ax.set_xlim(0, 200)
ax.set_xlabel('seconds since start')
ax.set_yticks([15, 25])
ax.set_yticklabels(['Bill', 'Jim'])
ax.grid(True) # 添加网格
ax.annotate('race interrupted', (61, 25),
            xytext=(0.8, 0.9), textcoords='axes fraction',
            arrowprops=dict(facecolor='black', shrink=0.05),
            fontsize=16,
            horizontalalignment='right', verticalalignment='top')

plt.show()
散点图
matplotlib.pyplot.scatter(x, y, s=None, c=None, marker=None, cmap=None, norm=None, vmin=None, vmax=None, alpha=None, linewidths=None, *, edgecolors=None, plotnonfinite=False, data=None, **kwargs)
# =============================================================================
# x, x值
# y, y值
# s, size即每个scatter的大小
# c, color及scatter的颜色
# marker, 默认:rcParams['scatter.marker'](为'o')即scatter形状
# cmap, 默认:rcParams['image.cmap'](default:'viridis')
# norm, default:None即标准化为0到1之间数值
# alpha, default:None即透明度
# linewidth, default:rcParams['lines.linewidth'](default:1.5)即线宽度
# edgecolors:{'face', 'none', None} default:rcParams['scatter.edgecolors'](default:'face')即边线颜色
# =============================================================================
# -*- coding: utf-8 -*-
"""
Created on Tue Jul 13 14:06:16 2021

@author: Bio-windows
"""

import numpy as np
import pandas as pd
import matplotlib.pyplot as plt

if __name__ == '__main__':
    '''main function'''
    np.random.seed(19680801)

    N = 50
    x = np.random.rand(N)
    y = np.random.rand(N)
    colors = np.random.rand(N)
    area = (30 * np.random.rand(N))**2

    fig, ax = plt.subplots()

    ax.scatter(x, y, s=area, c=colors, alpha= 0.5)

    ax.set_title('scatter plot')
    ax.set_xlabel('xLabel')
    ax.set_ylabel('yLabel')
    ax.spines[['top', 'right']].set_visible(False)
线性图
matplotlib.pyplot.plot(*args, scalex=True, scaley=True, data=None, **kwargs)
# =============================================================================
# x,
# y,
# color,
# marker, . , o, ^ < > 1 2 3 4 8 s p P * h H + x X D d | _
# markersize,
# markerfacecolor,
# markeredgecolor,
# linestyle, - -- -. : 线样式
# linewidth, 线宽度
# linecolor, 线颜色
# alpha, 透明度
# label, 这组数据的标签
# =============================================================================
# -*- coding: utf-8 -*-
"""
Created on Tue Jul 13 14:06:16 2021

@author: Bio-windows
"""

import numpy as np
import pandas as pd
import matplotlib.pyplot as plt


if __name__ == '__main__':
    '''main function'''


    x = range(30)
    y = range(30)

    fig, ax = plt.subplots()

    # ax.scatter(x, y, s=area, c=colors, alpha= 0.5)
    # ax.step(x, y)
    ax.plot(x, y, color='grey', marker='o', markersize=2, linestyle='dashed', linewidth=1, alpha=0.5, label='test')
    ax.legend()

    ax.set_title('scatter plot')
    ax.set_xlabel('xLabel')
    ax.set_ylabel('yLabel')
    ax.spines[['top', 'right']].set_visible(False)
阶梯图
matplotlib.pyplot.step(x, y, *args, where='pre', data=None, **kwargs)
# -*- coding: utf-8 -*-
"""
Created on Tue Jul 13 14:06:16 2021

@author: Bio-windows
"""

import numpy as np
import pandas as pd
import matplotlib.pyplot as plt


if __name__ == '__main__':
    '''main function'''


    x = range(30)
    y = range(30)

    fig, ax = plt.subplots()

    # ax.scatter(x, y, s=area, c=colors, alpha= 0.5)
    ax.step(x, y)
    ax.plot(x, y)

    ax.set_title('scatter plot')
    ax.set_xlabel('xLabel')
    ax.set_ylabel('yLabel')
    ax.spines[['top', 'right']].set_visible(False)
频率分布直方图
matplotlib.pyplot.hist(x, bins=None, range=None, density=False, weights=None, cumulative=False, bottom=None, histtype='bar', align='mid', orientation='vertical', rwidth=None, log=False, color=None, label=None, stacked=False, *, data=None, **kwargs)
# =============================================================================
# x, 柱子位置
# =============================================================================
表格直方图
matplotlib.pyplot.table(cellText=None, cellColours=None, cellLoc='right', colWidths=None, rowLabels=None, rowColours=None, rowLoc='left', colLabels=None, colColours=None, colLoc='center', loc='bottom', bbox=None, edges='closed', **kwargs)
# =============================================================================
# x, 柱子位置
# =============================================================================
饼图
matplotlib.pyplot.pie(x, explode=None, labels=None, colors=None, autopct=None, pctdistance=0.6, shadow=False, labeldistance=1.1, startangle=0, radius=1, counterclock=True, wedgeprops=None, textprops=None, center=0, 0, frame=False, rotatelabels=False, *, normalize=None, data=None)
# =============================================================================
# x, 柱子位置
# =============================================================================
轮廓和伪彩色
matplotlib.pyplot.pcolormesh(*args, alpha=None, norm=None, cmap=None, vmin=None, vmax=None, shading=None, antialiased=False, data=None, **kwargs)
# =============================================================================
# x, 柱子位置
# =============================================================================
matplotlib.pyplot.contour(*args, data=None, **kwargs)
# =============================================================================
# x, 柱子位置
# =============================================================================
极坐标图
matplotlib.pyplot.polar(*args, **kwargs)
# =============================================================================
# x, 柱子位置
# =============================================================================
3D
# =============================================================================
# x, 柱子位置
# =============================================================================
图例
matplotlib.pyplot.legend(*args, **kwargs)
# =============================================================================
# x, 柱子位置
# =============================================================================
Axes中的注释(annotate)
matplotlib.pyplot.annotate(text, xy, *args, **kwargs)
# =============================================================================
# x, 柱子位置
# =============================================================================
Axes中的网格(grid)
matplotlib.pyplot.grid(b=None, which='major', axis='both', **kwargs)
# =============================================================================
# x, 柱子位置
# =============================================================================
Axes中的边线(spines)
# =============================================================================
# x, 柱子位置
# =============================================================================
Tips
智能推荐
Juniper EX系列交换机堆叠配置-程序员宅基地
文章浏览阅读1.8k次。set version 12.3R6.6set groups member0 system host-name SHGYAS_SW_VC_01set groups member1 system host-name SHGYAS_SW_VC_02set apply-groups member0set apply-groups member1set system time-zo..._juniper ex4300 堆叠 delete
PHP 异常处理:Exception 类的使用技巧_php 原生代码中exception类-程序员宅基地
文章浏览阅读21次。通过遵循这些技巧和最佳实践,我们可以更好地使用PHP的Exception类来处理异常,提高代码的可靠性和可维护性。这些最佳实践包括只捕获需要处理的异常类型、提供有用的错误信息、在适当的地方抛出异常以及使用合理的异常类层次结构。Exception 类是 PHP 内置的基础异常类,我们可以通过继承 Exception 类创建自定义的异常类。在实际开发中,我们可能会遇到多种不同类型的异常,针对不同类型的异常,我们可以使用多个。在实际开发中,可能会遇到多种不同类型的异常,针对不同类型的异常,可以使用多个。_php 原生代码中exception类
面试时 Redis 内存淘汰总被问,但是总答不好,怎么解决?-程序员宅基地
文章浏览阅读895次,点赞11次,收藏26次。总的来说,面试是有套路的,一面基础,二面架构,三面个人。最后,小编这里收集整理了一些资料,其中包括面试题(含答案)、书籍、视频等。希望也能帮助想进大厂的朋友网上学习资料一大堆,但如果学到的知识不成体系,遇到问题时只是浅尝辄止,不再深入研究,那么很难做到真正的技术提升。需要这份系统化的资料的朋友,可以添加V获取:vip1024b (备注Java)一个人可以走的很快,但一群人才能走的更远!
为什么Redis使用单线程 性能会优于多线程?-程序员宅基地
文章浏览阅读639次,点赞17次,收藏8次。Redis作为一个高性能的内存数据库,通过巧妙地运用非阻塞I/O、多路复用等技术,充分地发挥了单线程模型的优势,避免了多线程可能带来的问题。所以在选择技术方案时,并非线程越多越好,而是需要根据实际情况权衡各种因素。Redis的成功经验告诉我们,合理地利用单线程模型,结合优化的数据结构和高效的I/O处理,能够实现出色的性能表现。
CentOS7 运维 - 引导过程及排除启动故障 | MBR扇区故障修复 | GRUB引导故障修复 | Linux管理员root账户密码忘记找回_centos7 引导故障-程序员宅基地
文章浏览阅读3.1k次,点赞2次,收藏4次。CentOS7操作系统引导过程一、系统引导过程总览排除启动类故障修复MBR扇区故障故障的原因故障现象解决思路修复GRUB引导故障故障原因故障现象解决思路如果忘记root用户的密码进入急救模式,重设密码系统服务控制Linux系统的运行级别查看运行级别临时切换运行级别ntsysv工具systectl工具永久修改主机名查看主机名的状态设置系统语言为中文查看当前系统使用的语言查看系统启动耗时一、系统引导过程总览1.开机自检服务器主机开机以后,将根据主板BISO中的设置,对CPU、内存、显卡、键盘等设备进行初步_centos7 引导故障
iOS中使用ZipArchive压缩和解压缩文件-程序员宅基地
文章浏览阅读930次。引自 http://www.36duo.com/thread-119-1-1.html在本教程中,我将演示如何在iOS程序中压缩和解压缩文件。我们将使用一个叫做ZipArchive的第三方库来实现。尽管压缩和解压缩有许多其他的方案可选,但是我觉得ZipArchive库是最快捷、最简单的解决方案。let’s go。为什么我需要解压缩文件有许多原因能解释为什么我要在工程中使_ziparchive
随便推点
领域模型驱动设计简介_领域模型创新点-程序员宅基地
文章浏览阅读1.1k次。1 简介领域驱动设计告诉我们,在通过软件实现一个业务系统时,建立一个领域模型是非常重要和必要的,因为领域模型具有以下特点:领域模型是对具有某个边界的领域的一个抽象,反映了领域内用户业务需求的本质;领域模型是有边界的,只反应了我们在领域内所关注的部分; 领域模型只反映业务,和任何技术实现无关;领域模型不仅能反映领域中的一些实体概念,如货物,书本,应聘记录,地址,等;还能反映领域中的一些过程..._领域模型创新点
二极管、三极管、场效应管的原理及特性_二极管 三极管-程序员宅基地
文章浏览阅读1.5w次,点赞22次,收藏131次。本文组要摘出了二极管、三极管、场效应管的原理及特性。主要目的是梳理它们的结构及原理,由于细细写来信息量还是蛮大的,所以难免会会有信息的丢失,但大体的结构是完整的。;-)一、半导体二极管 定义:奖PN结用外壳封装起来,并加上电机引线就构成了半导体二极管。 常见的二极管类型如图(1)图(1)普通二极管,主要是利用它正向导通,反向截止的特性(单向导电性)。_二极管 三极管
C语言学习笔记_c语言 x<y<z-程序员宅基地
文章浏览阅读496次。数据常量大分类字面常量: 直观写出来的值 const修饰发常量 #define定义的常量 枚举常量常量,const常变量int main(){ const int num = 1;\\const 表示常属性变量的创建 num = 8; return 0;}是不能运行的int main(){ const int n = 4; printf("%d\n", n); int arr[n] = { 0 }; r_c语言 x
Petya勒索病毒-程序员宅基地
文章浏览阅读1.2w次。Petya勒索病毒1、原理说明2017年6月27日晚,印度、俄罗斯、西班牙以及欧洲多国遭受大规模Petya勒索病毒袭击,该病毒远程锁定设备,并索要赎金。其中乌克兰地区受灾害最为严重,政府、银行、电力系统、通讯系统、企业等都受到不同程度的影响。此次攻击者采用早前Petya勒索病毒的变种,其传播方式和WannaCry类似,但该病毒除了使用永恒之蓝(MS17-010)漏洞之外,还罕见使用了黑客的横向渗透攻击技术。在勒索方面与WannaCry等不同之处在于,Petya木马主要通过加密硬盘驱动器主文件表(_petya
petapoco mysql_PetaPoco - 轻量级高性能的ORM框架(支持.NET Core)-程序员宅基地
文章浏览阅读332次。我们都知道ORM全称叫做Object Relationship Mapper,也就是可以用object来map我们的db。而且市面上的orm框架有很多,有重量级的Entity Framework,有轻量级的Dapper、PetaPoco等假如你喜欢原生的Sql语句、又喜欢ORM的简单、又追求高性能,那么轻量级的ORM框架是你的不二选择。说到轻量级ORM框架Dapper的名气比较大(因为出自名门?)..._petapoco
以软件测试的角度测试一支笔,软件测试面试:如何测试一支笔(铅笔,钢笔,中性笔)...-程序员宅基地
文章浏览阅读2.2k次。PS:以下都是从网上搜罗来的,版权比较难注明,主要目的是分享及讨论。如何一支铅笔?1,功能测试 能不能称作一只笔 是否能书写..2,性能测试 写起来是不是很流畅,压力测试 用多久能用完..可对比上市铅笔 有什么优点。3,用户体验 找适当人群组织群众使用 并跟踪记录使用后反应出来的效果。4,破坏测试 多大的力气可以折断啊...等等啊5,安全测试 铅笔芯是不是有毒,笔的木质是不是在折断时 弄坏手之类的..._自动化测试钢笔测试